How To Calculate Employee Turnover Rate: Formulas Plus Free Excel Template
According to Gallup, 42% of employee turnover is preventable but often ignored. The good news here is that almost half of the turnover companies are experiencing is avoidable. However, the first step toward lowering turnover is knowing how to calculate employee turnover rates.

Calculating employee turnover might seem like a straightforward metric, but it’s often trickier than you’d expect. While the basic formula is simple, factors like different types of turnover, varying timeframes, and employee movements within the company can complicate the process.
In this article, we propose a best practice for calculating employee turnover and share seven ways to help you reduce unwanted turnover. We also share a free downloadable template to calculate employee turnover rate. For more essential HR metrics to track and improve your workforce strategies, download our 51 HR Metrics Cheat Sheet. Let’s get started!
Contents
What is employee turnover rate?
How do you calculate employee turnover rate?
– Annual employee turnover rate
– Monthly employee turnover rate
– How to calculate employee turnover rate in Excel
Alternative approaches to calculating turnover
How to reduce employee turnover rate
FAQ
What is employee turnover rate?
An organization’s employee turnover rate measures the number of people who have left the company during a specific period. The turnover rate is often measured annually and can be calculated for the entire organization or per department, team, or other subcategories within the company.
Employee turnover is one of the most discussed metrics in the people analytics field. However, as those familiar with this topic might know, there is currently no ‘right’ way to calculate it. A quick online search reveals multiple formulas, even among professional organizations.
For example, the American National Standards Institute (ANSI), an institute dedicated to facilitating consensus standards, uses a definition different from that of the International Organization for Standardization (ISO).
So, to correctly answer the question of how to calculate employee turnover rate, we first need to further define what we mean by employee turnover.
- Employee: ANSI defines an employee as an individual ‘who received any payroll payment during the pay period that includes the 12th day of the month.’ Additionally, we would like to add that an Employee cannot be a new Hire – more about that in the next section.
- Turnover: Refers to individuals leaving the organization due to dismissal, attrition, and other reasons. They will not be on the payroll during the next period.
- Turnover rate: The percentage of employees who leave the organization within a given timeframe.
How do you calculate employee turnover rate?
While the above definition of ‘Employee’ may initially seem unnecessary, it is justified. Here is an example to explain this.
At the start of the quarter, there were 100 employees. During the quarter, 5 employees left, and 10 joined. At the end of this period, 105 people were working in the organization. Now, how do you calculate the employee turnover rate?
The question is, do we include everyone in our turnover rate denominator, or do we only include the existing employees (excluding hires)?
This highlights the importance of distinguishing between Employees, Hires, and Terminations—three distinct groups tracked with different metrics. Hires are individuals who joined the company during the period, and they’re typically measured using separate metrics like the hiring rate, 90-day turnover, or first-year turnover rate. For this reason, hires should not be counted as part of the employee base when calculating turnover.
Returning to our example:
- Starting employees: 100
- Terminations: 5
- Hires: 10
The turnover rate is calculated based on the original 100 employees. Therefore, the turnover rate is 5%, as 5 out of 100 employees left during the period.
This brings us to the general employee turnover rate formula that we recommend for use: 
This approach is in line with the description given in ISO 30414, a universal norm for Human Capital Reporting published in 2018. It divides the total number of leavers over a given period by the total number of people in the organization.
Annual employee turnover rate
Companies often calculate their employee turnover annually. If we follow the same logic as for the general employee turnover rate formula we just shared, the annual turnover rate formula is then formulated as follows:
Let’s look at another example to illustrate this.
At the start of 2024, there were 200 employees. During the year, 10 employees left, and 20 joined. At the end of 2024, 210 people are working in the organization. What’s the employee turnover rate?
Here, too, we have an annual turnover rate of 5%, as 10 employees out of 200 have left during the year.
Monthly employee turnover rate
Just like it’s possible to calculate the turnover rate per department or team, it is also possible to calculate it per year, per trimester, or month.
The formula for the monthly turnover rate is:
Let’s look at an example to illustrate this.
At the beginning of February, the company had 300 employees. During the month, 9 employees left, and 18 joined. At the end of February, 309 people were working in the company. What would be the employee turnover rate?
The monthly turnover rate is 3% because 9 out of 300 employees left during February.
How to calculate employee turnover rate in Excel
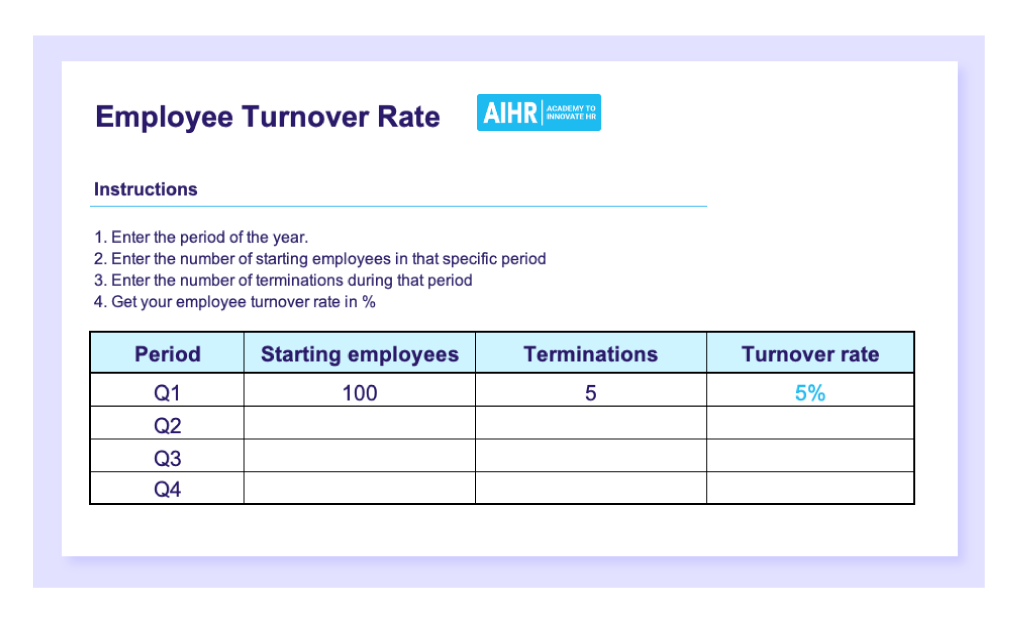
A logical next question, especially for those familiar with Excel, could be how to calculate employee turnover in Excel. To help you get started, we’ve created a simple and free template to calculate your organization’s (monthly or annual) turnover.
Alternative approaches to calculating turnover
While we recommend the formula discussed earlier, it’s useful to mention a commonly discussed alternative method for calculating employee turnover.
This approach is predominantly championed by ANSI and can also be found in multiple places online. It proposes that the turnover rate equals the # of terminations divided by the average # of employees for each of the 12 months in the designated annual period.
This alternative employee turnover rate formula poses three problems:
Problem 1
According to the ANSI definition, employees would include both current employees and hires. It mixes both the hiring numbers and rates and the turnover numbers. This leads to an ‘impure’ calculation. Consider the following example that we set over 3 months for simplicity reasons:
Original employee pool
100
90
80
Terminations per month
10
10
10
New hires per month
20
20
20
Total employees
100
110
120
We see that every month, 10 employees leave, while every month, 20 new hires join. According to this alternative calculation, there are 30 terminations and, on average, 110 employees: (100+110+120)/3. This makes the turnover rate 30/110 = 27%
Our proposed method shows a different number: 30 Terminations / 100 Employees at the start of the period = 30%.
Dissenting opinion by John Lipinski
John Lipinski is an analytics practitioner and advisory leader with a strong emphasis on actionable business intelligence for the real world. He is also an instructor in our AIHR Academy Data Science in R course.
“When it comes to the example above – assuming no new hires – I think the other approach measure would take the average of the people at the start (100) and at the end (70) for a denominator of 85.
30/85 = 35.2%. That might seem wrong, but remember that in January, you lost 10 people when you started with 100. By March, though, you lost another 10 when you were only starting the month with 89, so in one measure, your turnover is getting worse. You are losing the same absolute amount of people even though your starting pool is smaller. That is not a good trend.”
The difference is that Hires dilute the first formula. This is why we propose to split Hires and Employees into two distinct categories to arrive at a more accurate number. As mentioned before, Hires have their own set of metrics, including 90-day turnover and first-year turnover.
John Lipinski on hires and employees
“Overall, I think there is value in doing something like Retention for a given set at the beginning of a period and then treating the new hires differently. Still, I’m unsure what determines when a new hire becomes an employee. That decision would seem arbitrary and might just push the issue to another place.”
Problem 2
Our second concern is that this alternative approach allows for a changing denominator within the calculation time period, which poses another problem. Here is a simpler example to illustrate this.
Original Employee pool
100
90
80
Terminations per month
10
10
10
As you can see, every month, 10 people leave. The ANSI formula would propose to average the number of employees in the denominator, resulting in a turnover rate of:
Our proposed method shows a different number. 30 Terminations / Employees at the start of the period = 30%. Therefore, the 3-month turnover rate is 30%. This also makes sense, as 30 out of 100 people we started with left.
Problem 3
There is also a practical side to this story. The data we work with in these examples will come from a data pool or warehouse. The dashboards and reports created based on this input data need to comply with the system’s practicalities and measurements.
First of all, most of us will want to slice and dice our data. Regarding the changing denominator we discussed earlier, our metric should make sense at all levels of disaggregation. This means that the formula must also render a meaningful calculation at the individual level. Take this example of a single employee quitting. The period selected is 2 months.
Original employee pool
1
0
Terminations per month
1
0
Here, the alternative approach would come up with the following formula.
In our HR dashboard or HR report, we don’t want to have a reported 200% turnover when we make such a specific selection. This will be impossible to explain to a business partner or line manager.
In addition, we report on both our existing population and our recruits. This is another argument for separating Employees from Hires, as both have their dedicated dashboards.
John Lipinski on this example
“The other given example clarifies the issue at play, but it overlooks another possible problem, namely that at some point in the month, you had no employee. So, on any given day in that month, you had less than one employee working on average.
In this edge case, you would not say there was a 200% turnover. From another perspective, though, it makes sense: you lost one person, but on average, throughout the month, you had less than one employee working (they only worked part of that month).”
How to reduce employee turnover rate
While knowing how to calculate employee turnover is great, preventing it or at least significantly reducing it is even better. Here are seven tips to consider in that regard:
- Understand the reasons for turnover: What drives employee turnover in your organization? Is it stress? Employee dissatisfaction with their job or remuneration? Bad management? Reducing turnover starts with knowing exactly why people leave.
- Keep track of employee turnover data: Detailed turnover data is key to understanding people’s reasons for leaving the company. As mentioned earlier, it’s possible to measure turnover per team, role, gender, age, tenure, etc., and doing so will provide valuable insights.
- Conduct stay interviews: Stay interviews serve two main purposes, and both help managers and HR improve retention. On the one hand, their goal is to understand why people choose to stay with the company, and on the other, they aim to proactively tackle any issues that may lead to an employee’s premature departure.
- Conduct exit interviews: Exit interviews can be an excellent way for employers to collect valuable information about an employee’s experiences during their stay with the company. As people who leave tend to be (more) open and honest, conducting an exit interview enables employers to get feedback on the overall employee experience, identify issues in the employee life cycle, and, as a result, develop strategies to lower unwanted turnover.
- Prioritize your retention efforts: Use turnover data to focus your retention strategies where they’re needed most. For example, if manager turnover is significantly higher than in other areas, this is where your efforts should start.
- Focus on the fundamentals: A big part of preventing unwanted turnover lies in getting the fundamentals right. As we mention in our latest HR trends, employers and HR professionals who want to boost engagement need to focus on the key drivers that truly make a difference. We’ve identified five core factors:
- Fair remuneration, safe working conditions, and reasonable working hours
- Well-resourced managers with the tools to provide support and stability
- A work environment with strong team connections where people feel heard
- Clear growth opportunities and meaningful recognition
- Purpose-driven work that creates valuable contributions.
- Be clear about goals and expectations: Open communication throughout the employee life cycle helps manage expectations and lets employees know where they stand. It starts with letting people know what is expected of them during the recruitment phase and continues during onboarding and beyond. Transparent communication about goals and expectations also clarifies people’s:
- Performance goals
- Career growth opportunities, and;
- Learning and development possibilities.
A final word
Returning to the start of this article, over forty percent of employee turnover is preventable, which is great because it means there is still a lot of room for improvement. Before you can reduce your turnover, though, the first question you have to answer is how to calculate employee turnover in a way that works for your organization.
The formula we suggest in this article and the shared free template can help answer that question.
FAQ
Employee turnover rate is the percentage of employees who leave an organization during a specific period, typically calculated annually. It helps measure workforce stability and can be applied to the entire company or specific departments.
There is no such thing as a good turnover rate. However, there are average employee turnover rates per industry. For example, according to the U.S. Bureau of Labor Statistics, the turnover in the manufacturing sector in November 2024 was 2.4%; in construction, it was 3.6%; and in hospitality, it was 5.4%. If your organization has an employee turnover rate that is lower than the industry average, you could say it is a ‘good’ turnover rate.
There are various ways to calculate the employee turnover rate. The method we suggest in this article is as follows:
Learn more
Related articles
Are you ready for the future of HR?
Learn modern and relevant HR skills, online


