12 DEI Metrics Your Organization Should Track
DEI matters. Diverse executive teams and boards are more likely to outperform financially, while companies that show they value diversity see increased engagement and decreased turnover. What’s the impact of your DEIB efforts?

Knowing how to use DEI metrics to assess your organization’s efforts and then acting on the data is key to furthering the DEI mission. Companies are responsible for ensuring their employees reflect the communities they serve and building an equitable and inclusive environment for them to thrive.
Without a structured system to track Diversity, Equity, and Inclusion (DEI) efforts, organizations risk falling back into old habits and stalling progress. While DEI metrics don’t automatically mean you’re hitting your goals, measuring your progress is still essential. This data can reveal issues like management bias, unconscious bias, and fairness in the workplace.
Tracking DEI metrics needs to become a higher priority to ramp up much-needed DEI ventures. According to a Culture Amp report, the number of HR professionals who described their organization’s DEI efforts as surpassing basic compliance dropped 11% between 2021 and 2023.
For a comprehensive list of key HR metrics to track and improve your organization’s performance, download our 51 HR Metrics Cheat Sheet.
Contents
What are DEI metrics?
Why are DEI metrics important?
12 DEI metrics examples
1. Demographics across organization levels
2. Retention across employee groups
3. Employee turnover
4. Adverse impact
5. Candidate demographics
6. Employee advancement / Promotion rate
7. Equal pay and pay equity
8. Employee resource group (ERG) participation
9. eNPS
10. Initiative-focused DEI metrics
11. Accessibility
12. Workplace inclusion index
FAQ
What are DEI metrics?
DEI metrics indicate the state of Diversity, Equity, Inclusion and Belonging (DEIB) efforts at your organization. By benchmarking and tracking certain metrics, you can set DEI goals, assess DEI progress and outcomes, and develop accountability for your organization’s commitment to DEI.
DEI metrics measure fairness in the workplace, the strengths of your organization’s brand, and overall employee satisfaction. Some DEI metrics also focus on the financial return on DEI initiatives, which should be used to strengthen dedication to DEI and allocate additional resources.
Why are DEI metrics important?
Organizations don’t achieve true Diversity, Equity, and Inclusion by merely using catchphrases or making a list of DEI-sounding proposals. It must be integrated into core values and culture.
Diversity and Inclusion metrics guide organizations’ well-intentioned ideas to improve DEI practices for better results in operations and workplace culture.
DEI metrics matter because they accomplish the following:
- Track progress toward DEI goals: Without data, there is no quantifiable way to determine whether Diversity and Inclusion efforts are effective or where adjustments need to be made. Metrics are the conduit for measuring the effectiveness of DEI initiatives in moving toward the organization’s goals.
- Identify gaps and inequities: DEI metrics offer information you wouldn’t otherwise have access to. For instance, they can uncover areas where certain groups may be underrepresented or face disadvantages, such as pay disparities, fewer promotions, and higher turnover. These insights are crucial because they highlight areas for immediate attention. Then, HR can secure buy-in from leadership and focus on making changes that will create a more equitable workplace.
- Assure transparency: A cohesive workplace culture requires trust, and transparency is a strong factor in building it. Openly sharing D&I metrics shows employees that an employer is willing to be upfront about its state of DEI and is committed to creating an impartial and inclusive workplace.
- Improve business outcomes: DEI metrics provide the groundwork for improving DEI efforts. Research shows that when organizations grow in DEI, they experience positive business outcomes. For example, a report by Enterprise Strategy Group showed that organizations mature in DEI were “2.1x more likely to report usually beating their competitors to market.”
HR tip
Dedicated DEIB leadership roles have been reduced in the U.S. from 56% of organizations to only 41% two years later. This means DEI responsibilities are increasingly falling on other HR teams.
12 DEI metrics examples
You can’t always capture the full scope of Diversity, Equity, and Inclusion within an organization through numbers alone. However, metrics can help quantify specific aspects of it.
Depending on the size and make-up of your organization, all DEI metrics may not be applicable. You need to ask yourself certain questions before proceeding:
- Which of these metrics will best tell the most accurate story of DEI in my organization?
- Which of the metrics needs to be highlighted as an urgent priority?
- Where are key areas of concern or high risk?
Listed below are 12 practical DEI metrics to track: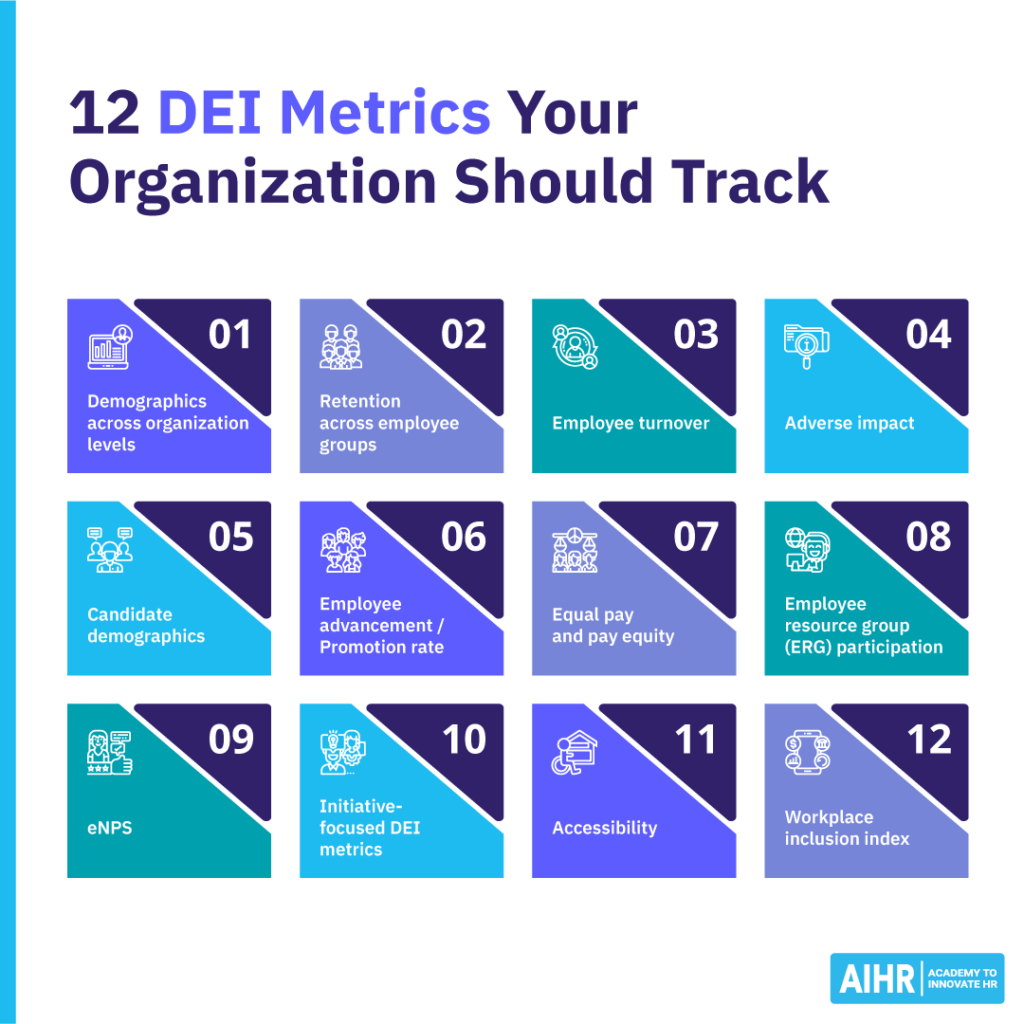
1. Demographics across organization levels
It often happens that an organization is diverse at the employee level but less diverse higher up. That’s why you need to understand your employee demographics not only on the company level but also within different levels, including leadership.
To calculate demographics across organization levels, you would divide the number of people in a particular demographic group by the total population.
For example, let’s say you were calculating the number of senior managers (400) between the ages of 60 – 65 (20). Your calculation would be: 20/400 = 0.05 or 5 %. This is a good starting point and would be known as your baseline data.
Here is an example of what company-wide diversity metrics look like on a dashboard: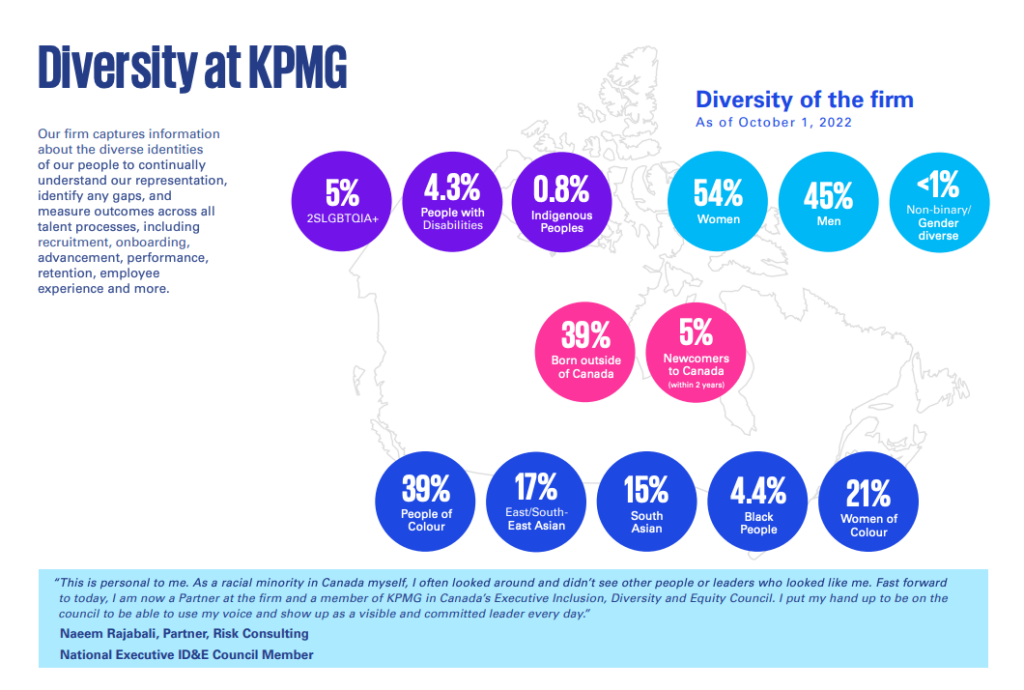
Here is another example from a DNA-testing company, 23andMe, which has the diversity data broken down into overall and leadership, as well as by department, and publishes it on their website.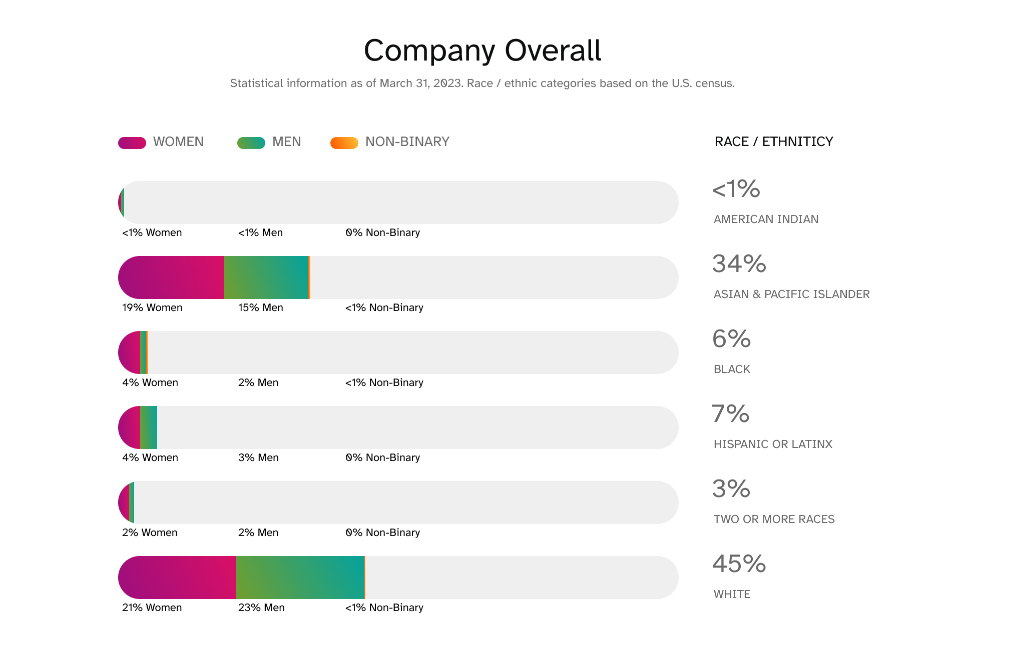
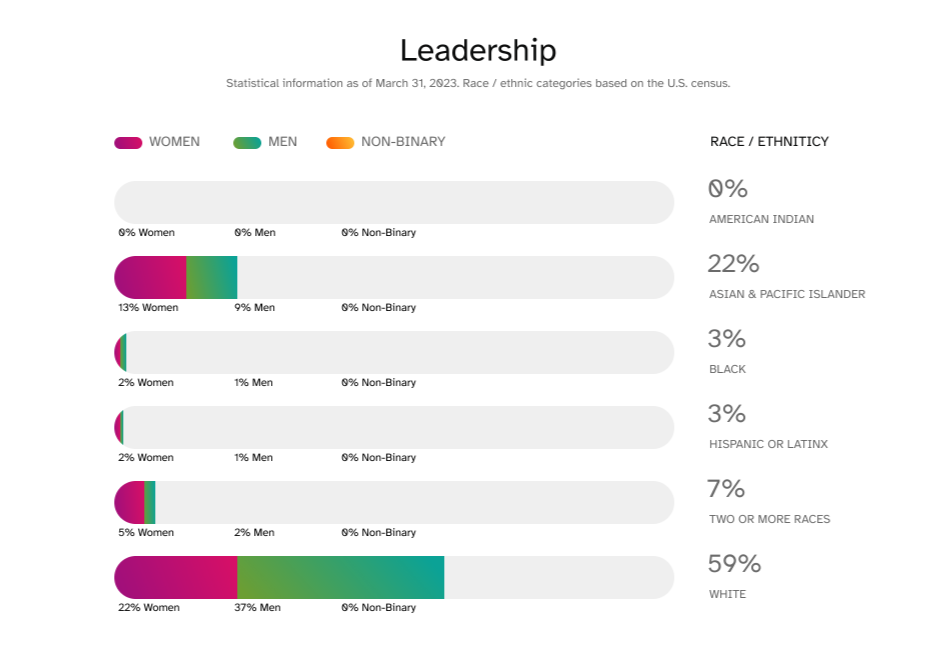
The 23andMe also describes on their website the concrete actions they’ve taken to foster DEI at their organization.
Publishing DEI data for everyone to see shows the organization’s commitment to DEI. It also lets your customers know that DEI is a priority, and your organization will be held accountable by the public as a result.
2. Retention across employee groups
How long certain employees stay with the organization can reflect your DEI efforts. Probing into your retention data will help you uncover any retention issues with particular groups of employees.
To calculate the employee retention rate, use the usual retention rate formula, but use the specific data of the employee group you’re calculating.
As an example, if you were to calculate the employee retention rate of women, your formula would look something like this:
The employee retention rate of women = Total # of employees – Total # of women who left / Total # of employees x 100
You can segment your population group even further to gain more interesting insights. For example, you might want to combine age group and gender. Or perhaps look at different generations (Gen Z vs. Millennials vs. Baby Boomers) and calculate the difference in retention rate.
You can combine these retention rate results with exit survey data to drill down into more specific reasons why employees of a particular demographic group are staying or leaving and then take action.
3. Employee turnover
While retention rate measures the percentage of people who stay, turnover measures the percentage of people who leave.
This is the formula for calculating employee turnover:
This key metric can be dissected to reveal turnover across employee groups based on gender, age, or race.
For instance, if an organization had 200 employees in the Baby Boomer age group and 30 employees left, the formula would look like this:
Turnover rate for Baby Boomers = 30 / 200 = 15%
Higher turnover rates in particular demographics can indicate a DEI disparity. According to an Ensono Speak Up Survey, nearly one-fifth of females working in tech in the U.S., U.K., and India were planning to leave their current role within the next year.
4. Adverse impact
Adverse impact happens when a particular policy or practice results in discrimination against certain groups of people. Calculating adverse impact allows you to measure the potential adverse impact at each stage of the employee life cycle.
For example, if you have a discriminatory practice in your recruitment stage, it trickles throughout the organization and has an adverse effect on Diversity, Equity, and Inclusion efforts. Once you identify a discriminatory practice, you can address it to make HR processes fairer.
To calculate adverse impact, you need to employ the “four-fifths rule.” This rule states that “the selection rate of protected groups – which include race, sex, age (40 and over), religion, disability status, and veteran status – should be 80% or more of the selection rate of non-protected groups to avoid adverse impact against the former.”
There are four steps to calculate adverse impact. We’ll use the recruiting process as an example:
- Determine the selection rate for each group. (For example, there are 100 applicants, and 10 of them are Black, that’s 10%.)
- See which group has the highest selection rate. (Let’s say, for example, Latinos had the highest selection rate at 40%.)
- For each group, determine the impact ratio by comparing it to the highest selection rate.
- Determine if the rate is less than the selection rate for the highest group. This is the four-fifth rule, in other words, at 80%. If it is less, then it means an adverse impact has been identified. In our case, 10/40 is 25%, which is less than 80%. Adverse impact is present.
SHRM provides another example of this:
“A comparison of the Latino selection rate (30 percent) with the Caucasian selection rate (60 percent) shows that the Latino rate is 30/60, or one-half (50 percent) of the Caucasian rate. Because one-half (50 percent) is less than four-fifths (80 percent), adverse impact is usually indicated.” – SHRM.
5. Candidate demographics
DEI endeavors must include attracting applicant pools containing different races, backgrounds, ages, genders, etc. What kind of candidates are you attracting, and from what sources? How is diverse talent progressing through the funnel? This indicates which sources attract candidates from diverse backgrounds and whether you’re using inclusive language in your job postings, etc.
You can collect candidate demographic data anonymously during the application process. For each stage and each demographic group, calculate it as a percentage of the total number of candidates through each stage.
Along with calculating demographics at each step of the hiring process, it’s also a great idea to ask your talent acquisition professionals to take Harvard’s Implicit Association Test. It’s an eye-opener for evaluating unconscious biases.
Develop the skills to effectively track DEI metrics
Accurately selecting and measuring DEI metrics is crucial for any HR professional committed to fostering an inclusive and equitable workplace.
In AIHR’s Diversity, Equity, Inclusion & Belonging Certificate Program, you will learn to track and analyze key DEI metrics to drive meaningful change in your organization.
This online, self-paced program also covers how to turn DEI data into actionable insights, aligning your efforts with broader business strategies.
6. Employee advancement / Promotion rate
An organization committed to DEI will support talent mobility among diverse employees. This will be reflected in your promotion rate.
To calculate employee advancement or promotion rate, use the formula:
Number of employees promoted in the group/headcount.
Once you have the overall number, you can start looking into promotion rates across different groups and how they compare to your general employee advancement rate.
Despite the progress made in promoting Diversity, Inclusion, and Equity in the workplace, McKinsey research shows that women are still experiencing slower promotion rates than men. This is further exacerbated for women of color, who lose ground at every step of the promotion pipeline.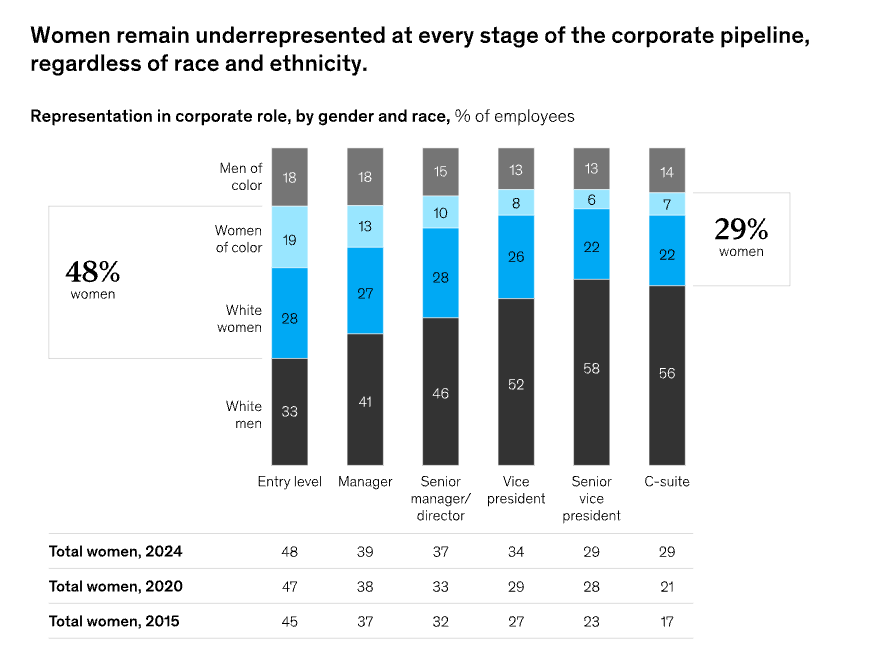
7. Equal pay and pay equity
Looking at pay disparities within your organization will help you uncover potential pay practice problems so you can design solutions to remedy them.
One of the most notable issues in diversity is equal pay for equal work. There is often a sentiment that people from different demographic groups are compensated differently for doing the same work. That is why it’s important to calculate this regularly.
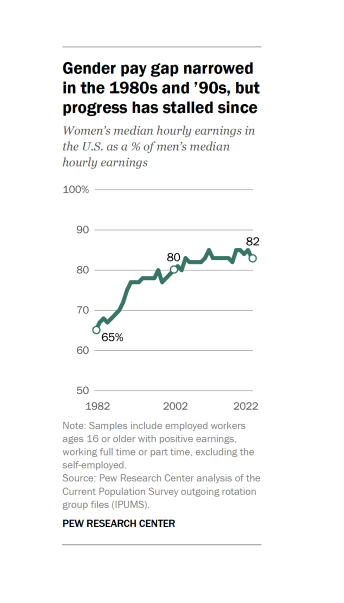
Let’s use gender as the variable to understand the calculation. Before starting, you would need the following information:
- List of all relevant employees
- Gender of all relevant employees
- A list of ordinary pay received (allowances, base salary, leave, and any other pay variables relevant to your organization.)
- Sign-on bonuses and annual bonuses
- Weekly working hours of all relevant employees.
To determine whether there is a gender pay gap on average, you would need to calculate the average hourly pay of male employees and female employees. Then, add up the average hourly pay of all male employees and divide it by the number of male employees. Do the same for female employees. Then subtract the average female hourly rate vs. the average male hourly pay rate, divided by the average hourly pay rate for males, multiplied by 100.
For example, an organization has an average hourly pay rate for males at $50 and $42 for females:
$50 – $42 = $8
$8 / $50 = 0.16 x 100 = 16%
Therefore, the average gender pay gap is 16%. You can do the same calculation for other demographic groups.
A detailed pay equity analysis will help you understand pay disparities across your organization.
8. Employee resource group (ERG) participation
Employee resource groups aim to give a voice to various workplace groups who share a common identity. If your organization has ERGs, what are the participation rates? Knowing the participation rate will help you determine if these groups actually serve their purpose.
Calculate the overall participation of employees in ERGs by taking the number of employees actively participating in ERGs divided by the number of employees in the organization.
You can also understand ERG participation by looking at the frequency of meetings and initiatives and the effectiveness of any projects. Also, assess which ERGs are most active and why. Explore reasons why employees may hesitate to participate in ERGs and consider establishing new ERGs to reach more employee groups.
9. eNPS
The employee net promoter score (eNPS) evaluates employee loyalty and engagement by polling employees on whether they would recommend the organization to others as a desirable place to work.
Positive eNPS scores can imply an inclusive and satisfying workplace culture. Again, you should break it down per demographic group to better understand if there are differences between them.
If you’re conducting annual employee surveys and measuring eNPS, be sure to include open-ended questions. That way, if there is a low eNPS within a particular demographic group, you’ll have more in-depth survey responses to help you understand why.
When done right, DEI metrics are a powerful way to track progress, measure impact, and prioritize initiatives. Instead of only focusing on the numbers, look at the story that the data tells in relation to where you are spending DEI efforts.

10. Initiative-focused DEI metrics
These metrics measure the outcomes of DEI-focused initiatives. For example, if you were to run an accelerated leadership program for Black employees, there should be a way to measure its success.
This is not only to establish if the participants completed the program but also the financial and business outcomes of it. To do this, you need to have a particular goal in mind. The goals should also be further broken down into specific DEI outcomes that the particular initiative addresses.
After you launch an initiative, you can measure the results of it by tracking:
- Sales growth correlated to the diversity initiative
- Revenue per employee (Segmenting the particular target group to understand the impact of the initiative.)
- Promotion rates (For example, for a program that targets accelerated promotion for under-represented groups.)
- Job level representation
- Net promoter score.
You can also approach it differently and quantify the initiatives. For example:
- Number of events organized by your ERGs
- Number of participants per ERG event / in total
- Number of participants in voluntary diversity training.
Finally, tracking the metrics of any DEI&B-focused initiatives your organization creates is important. These can include recruitment programs at local historically black colleges and universities or accelerated leadership programs for women. After all, you won’t be able to measure their success without looking at the numbers.
You can make it easier on your future self by setting clear, measurable goals for these initiatives at the beginning. These goals will point you directly to which metrics to measure.
For example, you might measure:
- Promotion rates
- Net promoter score
- Number of participants in an event
- Number of new hires from the initiative.
11. Accessibility
Ensuring all employees can navigate their work environment and have equal access to materials and amenities upholds DEI. It’s important to consider any potential barriers certain employees may have with physical spaces, social circumstances, or technological tools.
According to AIHR’s HR Subject Matter Expert, Marna van der Merwe, understanding employees’ accessibility barriers is a way to identify obstacles or underlying issues that may be affecting the broader workforce.
For example, she explains that neuro-divergent employees may struggle with a lack of flexibility regarding mandatory office days, which can impact their ability to be productive and contribute effectively. Rather than viewing these challenges as isolated cases, being attuned to such groups can provide insight into deeper Diversity and Inclusion barriers within the workplace.
Consider the following:
- Can all employees move about and access all parts of the workplace?
- Are software programs, learning materials, and internal communication methods accessible to all employees and compatible with assistance technologies?
- Are bathroom facilities suitable, private, and comfortable?
- Is there specialized equipment that could help better accommodate an employee’s disability?
- Can workstations be modified for those who require either a quiet or stimulating space to function optimally?
- Is there an opportunity to recognize various cultural traditions and religious holidays?
Accessibility metrics you can monitor and analyze include:
- Accommodation requests – Types and number of disability accommodation requests, as well as how the accommodations were granted and how long it took.
- Physical accessibility – The quantity of accessible workstations that are available and assistive devices provided.
HR tip
It’s not just the employees who need accommodations that want to see accessibility prioritized in the workplace. According to Pew research, 50% of workers say it’s “extremely” or “very important” to them that their organization is accessible for those with physical disabilities.
12. Workplace inclusion index
A workplace inclusion index assesses the level of inclusion employees perceive. It can display the sentiment of all employees or be broken down into groups, such as by identity, role, or location. You can also compare the groups to each other to identify disparities.
The data for the workplace inclusion index is collected via survey, with response choices often being:
- Strongly agree
- Agree
- Neither agree nor disagree
- Disagree
- Strongly disagree
To calculate the workplace inclusion index, you start by assigning a weight to each category of question, such as:
- Fair and respectful treatment (survey score: 77/100, weight: 35%)
- Safety and needs (survey score: 82/100, weight: 30%)
- Opportunity to succeed (survey score: 74/100, weight: 35%)
Next, multiply the score of the question category by the assigned weight and add the weighted scores together to get the overall inclusion index:
- (77 x 0.35 = 26.95)
- (82 x 0.30 = 24.60)
- (74 x 0.35 = 25.90)
26.95 + 24.60 + 25.90 = 77.45 (inclusion index)
Then you can find the inclusion index for a certain group and compare it to the overall inclusion index, such as the following example of women:
Women:
- Fair and respectful treatment (75 x 0.35 = 26.25)
- Safety and needs (78 x 0.30 = 23.40)
- Opportunity to succeed (70 x 0.35 = 24.50)
26.25 + 23.4 + 24.50 = 74.15 (inclusion index – women)
With repeated surveys and tracking this index over time, you can gauge whether DEI efforts are having an effect.
Over to you
If you don’t monitor and judge the impact of your DEI initiatives, they can become futile. Measuring DEI initiatives with appropriate metrics over an extended period maintains accountability and shows you where you started, what’s been effective, and where the organization still needs to go.
While tracking your Diversity and Inclusion metrics is important to understanding the state of DEI and its progress at your organization, it is even more critical to turn this data into actionable insights and use it to cultivate a culture that embraces all employees.
FAQ
A DEI metric is a statistic that marks where an organization stands in its quest to promote Diversity, Equity, and Inclusion within its workforce.
DEI metrics matter because they provide tangible insight into an organization’s capacity for Diversity, Equity, and Inclusion.
Learn more
Related articles
Are you ready for the future of HR?
Learn modern and relevant HR skills, online

